Excel for Advanced Digital Analytics Dashboard
In this course, you will learn how to use various Excel features and functions to create an advanced digital analytics dashboard.

Classes will be held on 14th and 21st September from 10:00 AM - 1:00 PM CST (US)
Course Description
In this course, you will learn how to use various Excel features and functions to create an advanced digital analytics dashboard.
This course focuses on both technical skills and creative design elements.
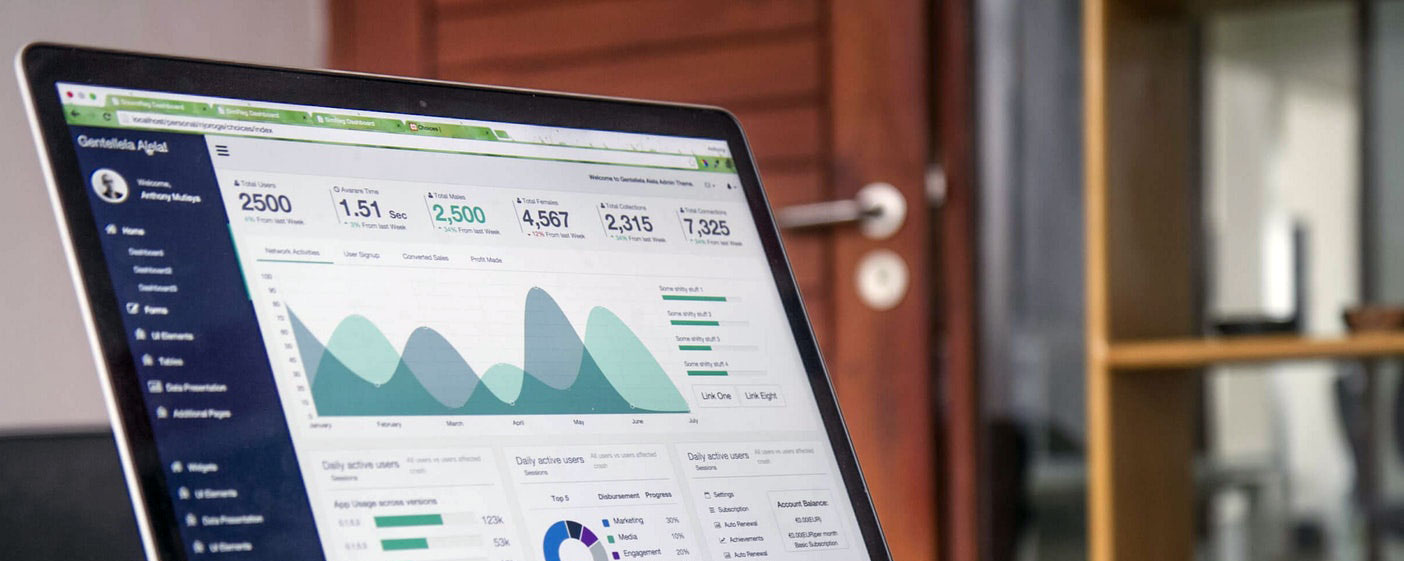
The output of the workshop is a workbook that contains a single page, aesthetically balanced analytics dashboard, along with each of the tabs that the student used to build the dashboard from raw data.
This workbook can be used as a future point of reference to recall the methods used to create each element in the dashboard.
Course Objective
To provide you with mastery of concepts that you can use in various roles and functions, not just Digital & Marketing Analytics.
- Excel Formulas
- Pivot-Tables
- V-Lookup
- Conditional Formatting
- Camera Images
- Forecasting
- Graphs
- Smart Art
- Concatenate
- List item three
- List item four
Instructor

Rebecca Visconti has been working in the Data Analytics & Marketing space for 16 years, working with brands like Starbucks, Kraft, P&G, MoneyGram, Kate Spade, GM Financial, and many more.
In addition to her full time role, she is passionate about teaching and has been providing training to clients throughout her career and has also been teaching at two major universities in Texas since 2015.
She loves helping others learn and develop their skills to further their careers.

"Rebecca Visconti's Excel class was highly valuable. She is kind, easy to understand, and provides great real-world examples. I am more confident in my ability to leverage Excel and find new formulas and functions as I need them."
Emily Bywaters, Communications Director